
Google Analytics 4 (GA4) is the latest version of Google’s Universal Analytics platform, allowing you to measure traffic and engagement across your websites and apps.
In this guide, you’ll learn everything you need to know to get started with Google Analytics 4, from exploring the difference between the platforms to setting up and best practice tips on how to use it for your reporting.
What’s new in GA4 and why is it changing?
On July 1, 2023, UA will be replaced by GA4, a cookie-free method of measuring traffic with additional data such as predictive insights and deeper integration with Google Ads.
In a statement, Russell Ketchum from Google, said: “Universal Analytics was built for a generation of online measurement that was anchored in the desktop web, independent sessions and more easily observable data from cookies. This measurement methodology is quickly becoming obsolete. Meanwhile, Google Analytics 4 operates across platforms, does not rely exclusively on cookies and uses an event-based data model to deliver user-centric measurement.”
Please note that you’ll be able to access your previously processed data in your Universal Analytics property for six months before it’s been decommissioned entirely.
As a result, there are significant differences between the platforms, including:
- Event-based data model: GA4 uses an event-based data model, which means that each user interaction is tracked as a separate event. This makes it easier to track complex user journeys and to understand how users interact with your website or app.
In comparison, Google Analytics has always relied on a session-based model which grouped user interactions within a given time frame.
This means that it was harder to track separate events, such as Form Start (the first time a user interacts with a form) vs Form Submit (when the user submits a form), and all those had to be set up via Google Tag Manager. GA4, in comparison, offers a number of events that are collected automatically, including the above.
The full list of those events can be found here.
Please note that those events will be only visible to you when they occur on the site.
- Cross-platform tracking: GA4 can track users across multiple platforms, including web, mobile, and connected TV. This makes it easier to get a complete picture of how users interact with your brand.
- Privacy – to protect user data, IP addresses are no longer stored in GA4. This combined with the ability to delete data at a user request and stricter retention policies means that privacy has been improved.
How do I set up GA4?
Setting up GA4 is relatively easy:
- Go to the Google Analytics website and sign in to your account.
- Click the “Admin” tab – the gear icon – bottom left navigation.
- Select the right “Property” section that corresponds to your website or an app.
- Click “GA4 Setup Assistant”.

5. Start the set-up using the “Get Started” button.

6. In the next pop-up screen, click “Create Property”.

Please note that the option above assumes that you already have a Google Tag set up for your existing property. If that’s not the case, please refer to steps 6-7 and follow Google’s advice on setting up a tag for your property.
What’s next?
Your journey with GA4 is only just beginning. Once you have your GA4 set up, it’s time to ensure that all the recommended features are enabled, from Google Ads links to conversions and audience tracking.
Please note that after completing each of the steps, mark the row as complete. Otherwise, you will be receiving notifications about your GA4 setup not being completed.
GA4 Setup Assistant

Data Collection
To start collecting data, it is important to start with adding a web data stream to your GA4 property.

For the website, click on “Web” and follow the instructions from the video below.
Once your website is set up, you need to add your tag to start seeing the data flowing. This can be done:
- via your website’s CMS system, for example Hubspot or Shopify ( for the list of CMSs and the tag instructions, please click here)
- manually, pasted immediately after the <head> on each page of your website
- Via Google Tag Manager – follow the instructions here
Google Signals
This option allows you to collect additional data from sites and apps about users who have turned on ads personalisation and who have signed in to their Google Accounts. This is especially useful for cross-device reporting, remarketing and targeting. As an example you can track users who visited your ecommerce site on their phone, who later returned to make a purchase on their laptop.
All you have to do is enable all the Google Signals collection points and when you return to the Setup Assistant, mark this action as completed.

Set up conversions
As mentioned above, some of the events are automatically set up within GA4 – you can find those by going to the “Admin” section in the bottom left and “Events”. There, you will find the list of all the events that have been recorded on the account.

The next step is to mark any important ones as conversions by using the toggle below. Those can include:
- Form completions
- Brochure downloads
- Phone/Email clicks

You can also automatically migrate your Universal Analytics goals to GA4 events using Google’s migration tool:

Follow those steps:
- Click “Import from Universal Analytics”
- Select the goals you’d like to import from Universal Analytics and add to events in GA4.
Please check if there are already existing events created automatically before selecting any via the migration tool.
- Click “Import selected conversions” in the top right.
- Mark the row as complete.
If you want to use Google Tag Manager to create additional goals, follow this guide.
Define Audiences
Audiences are user groups based on certain criteria, for example website visitors, or visitors who made a purchase. They can be used with Google Ads for remarketing purposes, for example, to target users who visited the website but didn’t make a purchase.
You can easily migrate your existing Universal Analytics to your GA4 property using the migration tool. This activity involves installing the Google Sheets add-on which you need to import the existing audiences from Universal Analytics.

[Image by Google]
- Import audience to a Google Sheet.
- Review each audience to decide whether you want to keep it or whether you want to modify it, for example change any criteria included in the segment, like country or a landing page path).
- Export your audiences from the Google Sheet to your Google Analytics 4 property.
For more details, please check out this guide here.
Please note that to use this tool you need to have the editor access for the property.
Link to Google Ads
By linking Google Ads with your Google Analytics 4 you will be able to track your ad campaign performance and use audiences for remarketing purposes, which is why the step above is extremely important, especially when you run paid campaigns.
- To link the account, in Setup Assistant, click the ‘Not started’ menu forward arrow and select “Manage Google Ads links”.

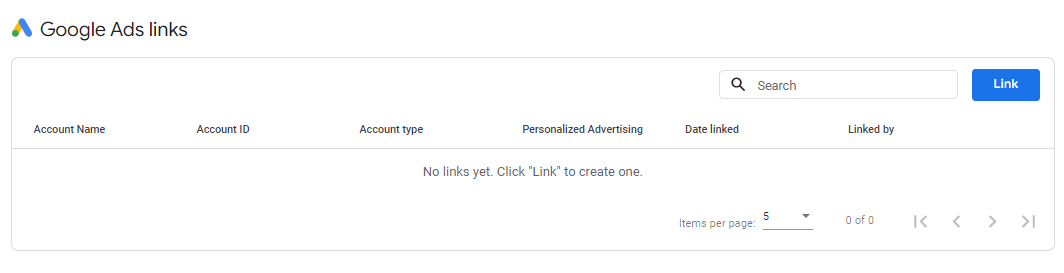
- Click Choose Google Ads accounts.
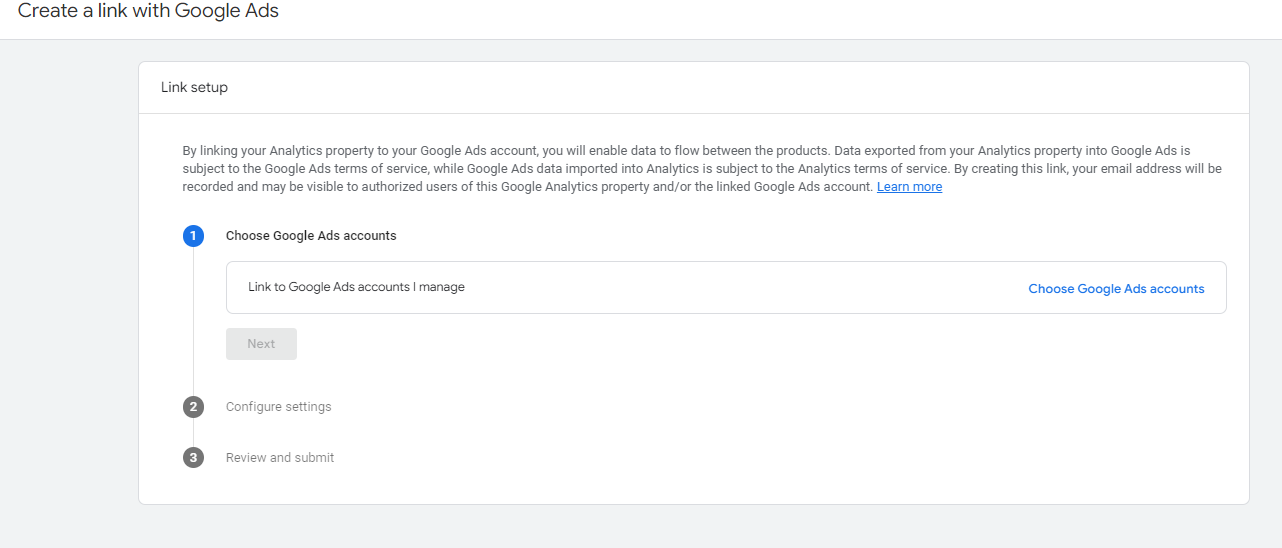
- Select the Google Ads accounts you want to link.
- Click Confirm and mark the row as complete.
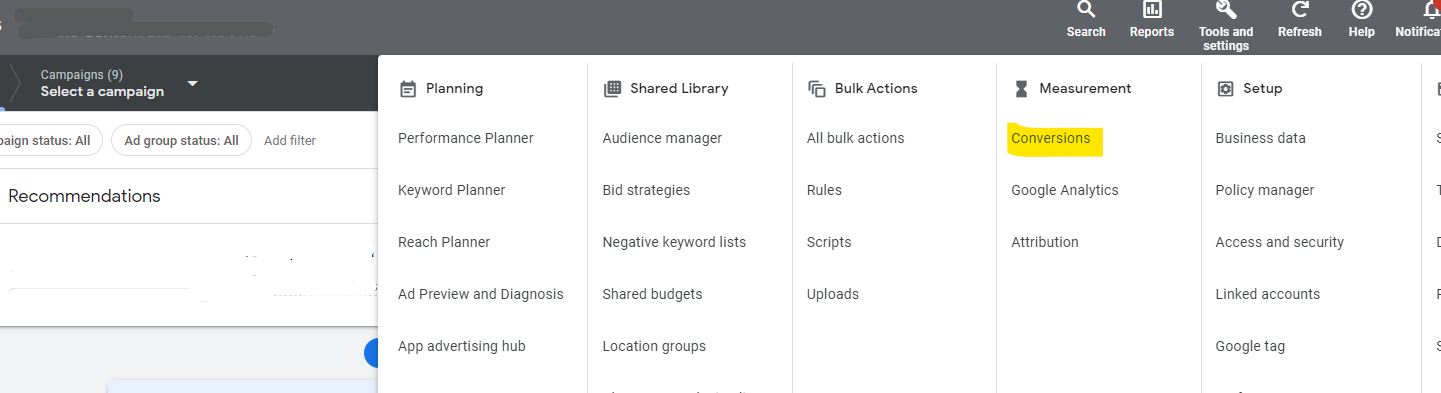
Bid on GA4 conversions
If you’re bidding on Universal Analytics conversions in Google Ads, you need to update your ads account and switch to GA4 conversions. To complete this step, you need to go to your Google Ads account. Form there:
- Click “Tools and settings” in the top right corner and then select “Conversions” from the Measurement section.
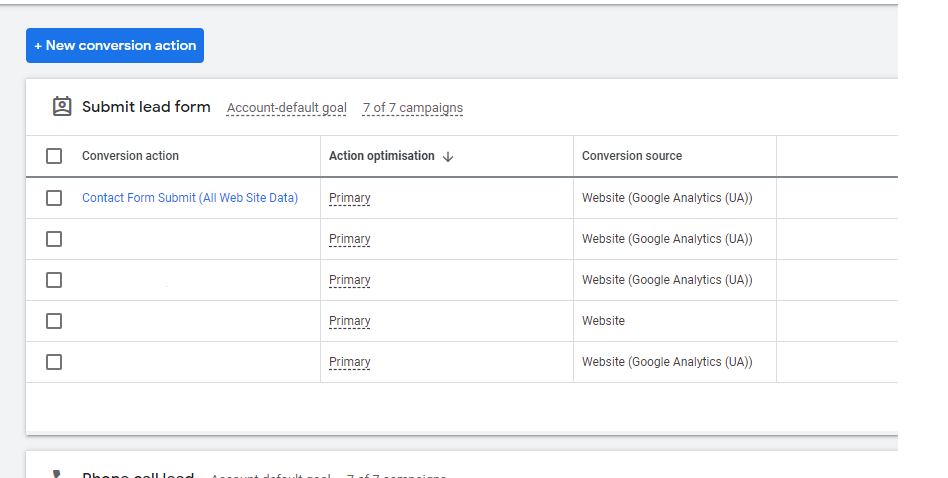
- Click “+New conversion action”
- Click “Import” and select Google Analytics 4 properties.
- Select all the conversion events you want to import, then click “Import and continue”.
- Go back to the “Tools and settings” in the top right corner and then select “Conversions” from the Measurement section.
6. Identify all “Website (Google Analytics (UA))” sources.
Please make sure all your existing sources have the GA4 equivalent. Otherwise please refer back to step 3 and the instructions for creating events using the Google Tag Manager.
7. Edit goals and update the status of each by clicking the drop-down and select either Secondary action (observe only) or Primary action.
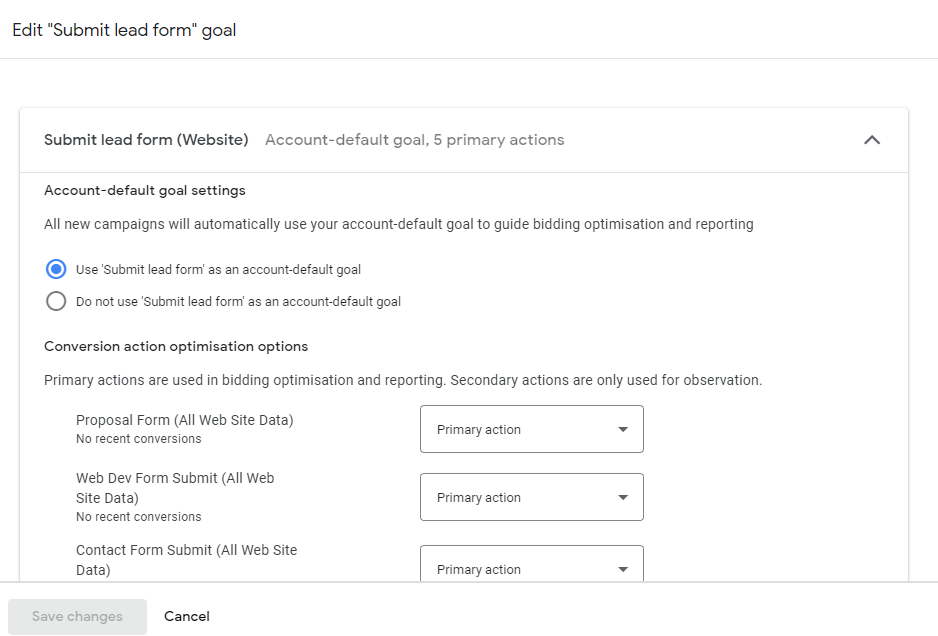
8. Click “Save changes”.
Target ads to GA4 audiences
Some audiences are automatically created in GA4, mainly the ‘All Users’ audience including all web visitors.
If you have only one audience as above, all you need to do is to apply your new audience targeting to your campaign or ad group. Follow the steps here.
If you don’t have an audience at all, the good news is that all you have to do is to mark this step as complete.
If you have a number of audiences, you can use Google’s Migration tool to
- Check which audiences are compatible with GA4
- Migrate them to GA4
Since this is a lengthy process, and specific to Google Ads users, we recommend following this guide.
GA4: Useful data and metrics
Engagement rate
Although Bounce Rate is not available as standard in GA4, a new metric called ‘Engagement Rate’ enables you to identify how your customers are interacting with your site. It gives you a percentage of engaged sessions on your website or mobile app.
However, to understand this metric fully, and how it compares to the Bounce Rate, here are the definitions:
- A bounced session- a session during which a user opens a single page on your site and then exits without taking any actions.
- An engaged session – a session that lasts longer than 10 seconds, has a conversion event, or has at least 2 pageviews or screenviews.
Is the engagement metric better than our beloved Bounce Rate?
Well, you could use both.
The engagement rate gives you more depth when it comes to user interaction with the site or a particular page, rather than simply giving you the exit rate.
For example, when a user visits your website for less than 10 seconds and leaves, this is recorded as 100% Bounce Rate.
With GA4, you can use both the engagement rate and bounce rate metrics to measure the true engagement on your website.
While the above won’t be counted as an engaged session, as it doesn’t provide any valuable information or insights into user behaviour, combined with the bounce rate you can have an understanding of how users interact with your pages and identify areas for improvement.
User stickiness
Most of the options are similar to UA, therefore I’m going to cover ‘User Stickiness’.
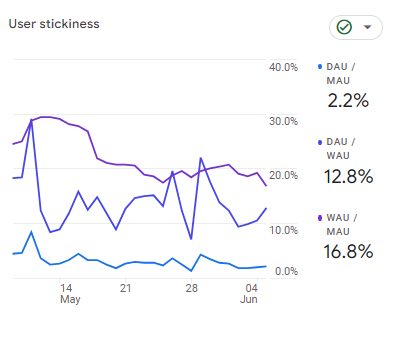
This is a useful report comparing engagement by active users over a narrower time frame with their engagement over a broader time frame.
- Daily Active Users (DAU) / Monthly Active Users (MAU)
- Daily Active Users (DAU) / Weekly Active Users (WAU)
- Weekly Active Users (WAU) / Monthly Active Users (MAU)
The higher the percentage for the ratios above, the more engaged are your users, which means they are returning on a regular basis.
This might be an important metric when you want to attract return purchases and visitors. Consequently, this can drive your decisions in terms of user retention and the relevant campaigns like email marketing for cross and up-selling.
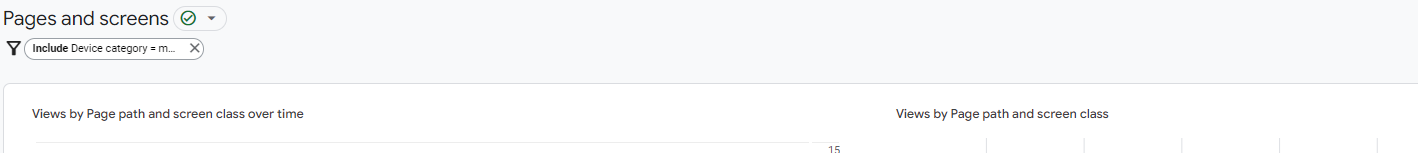
Pages and screens
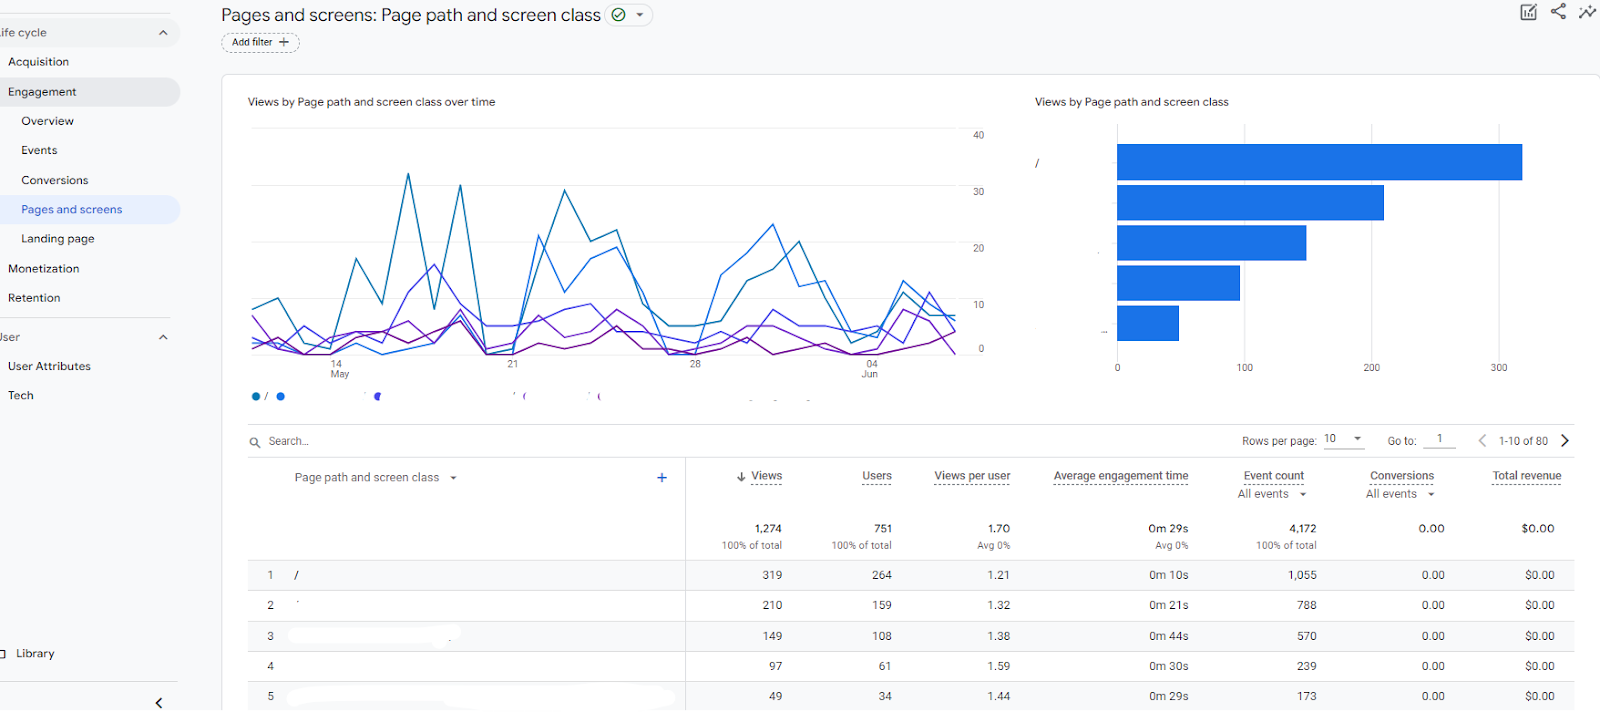
The pages and screens report shows how your website and mobile apps are performing according to page and screen views.
Where it gets interesting, it’s the customisation options allowing you to include additional information for better insight.
For example, say you want to view the pages that are most popular for certain locations or look at mobile vs desktop performance. Here is an example for the latter:
- Click the “Add filter” button to get started.
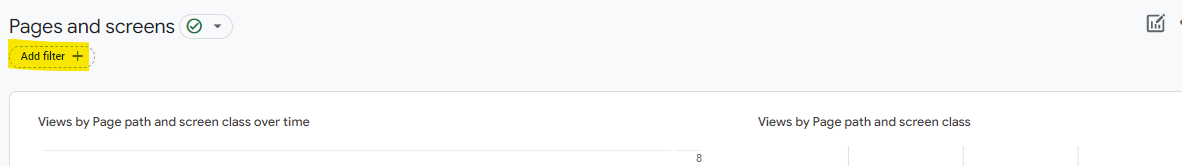
- On the right hand side, you will see a builder allowing you to select categories and dimensions. Select “Device category” and “Mobile” for values.
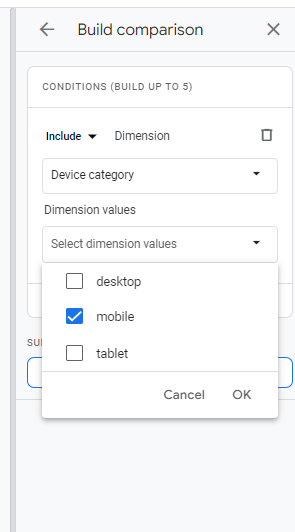
- Click “Ok” and “Apply” at the bottom of the screen. Your report will change, only showing the relevant data – mobile visits in this example.
UTM & campaign tracking
UTM data can be seen in the standard Reports under Acquisition.
Just go to ‘Traffic acquisition’ and use the drop-down in the first column to select ‘Session campaign’
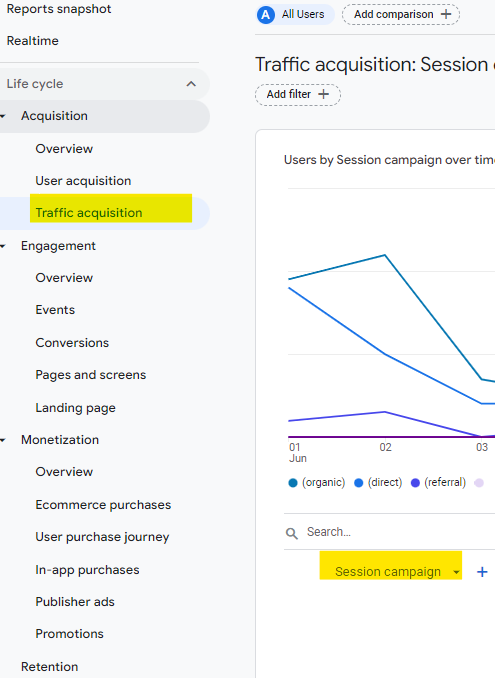
There, you should be able to see the campaign name you set up when creating your UTM tracking code.
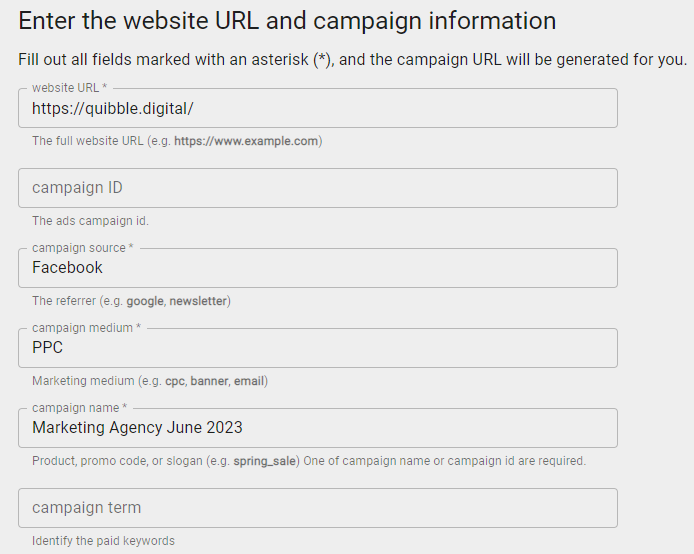
Make sure your naming conventions are simple when creating your UTM codes to be able to easily distinguish between campaigns and if you run multiple ones, they are organised allowing you to easily see the sources and date. Example below.
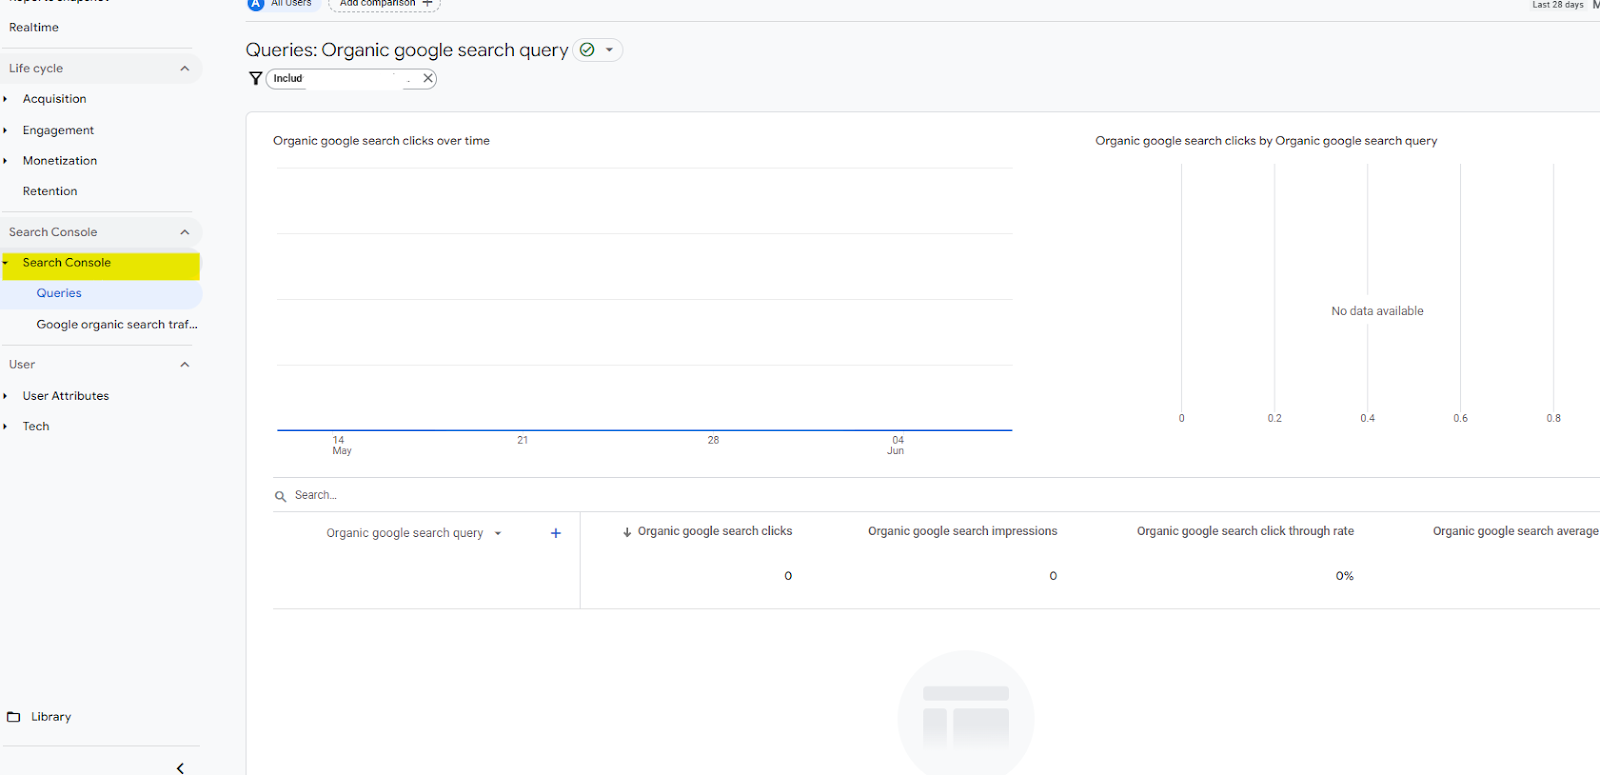
Search query report
To view organic keywords that drive traffic and conversions, you need to connect Google Search Console to your GA4.This is different to Universal Analytics where this was a default feature.
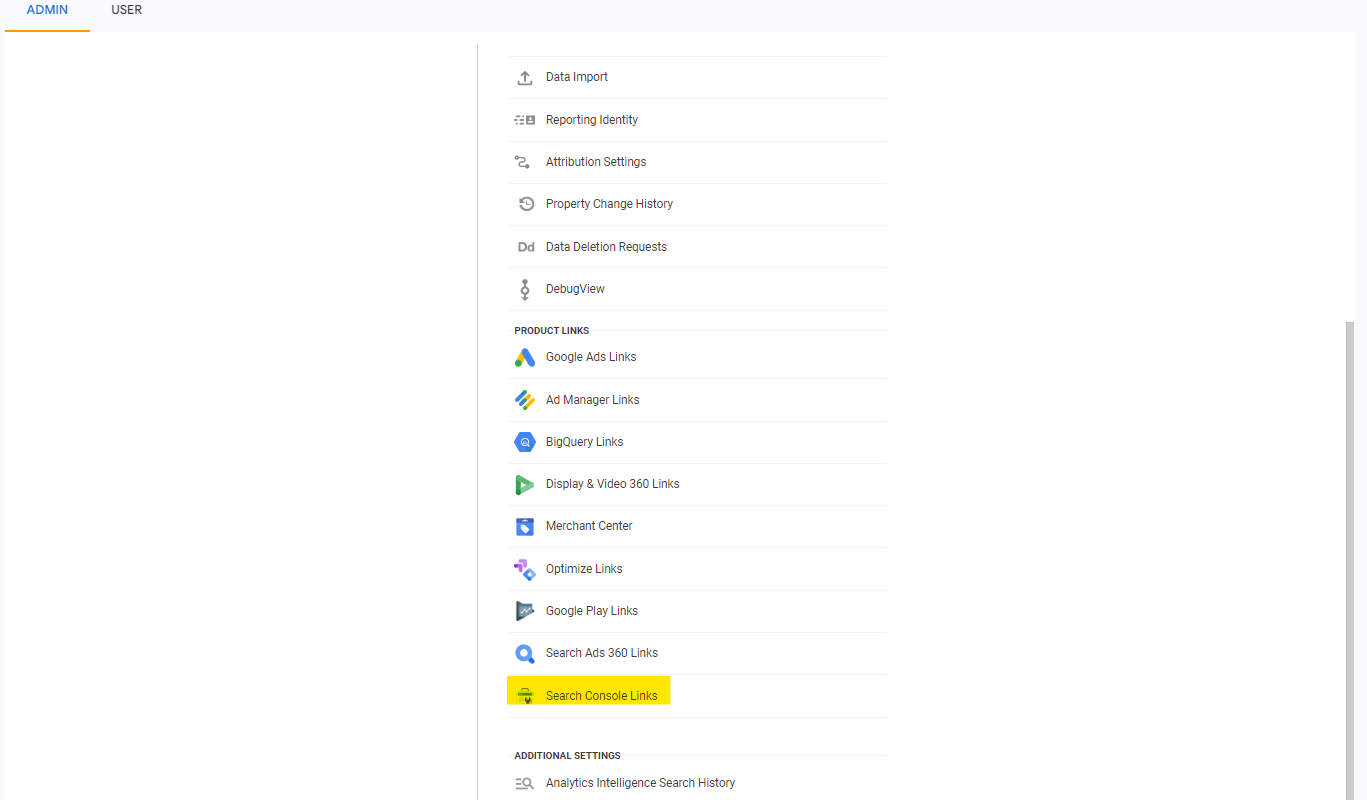
- Go to the “Admin” and select Search Console Links under Product Links in the Property column.
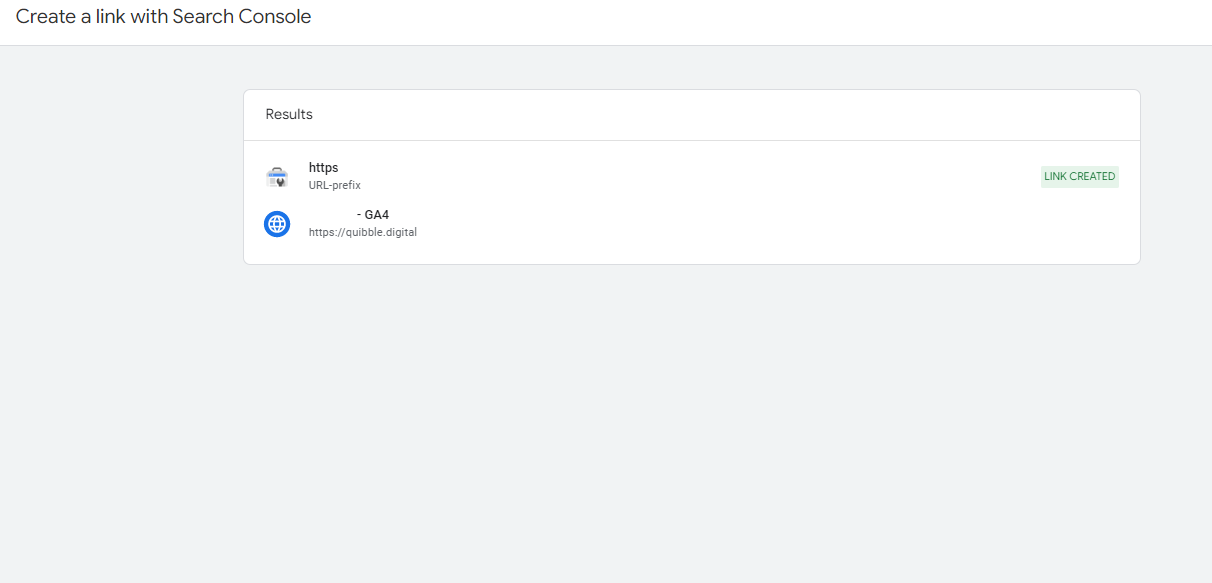
- When you click “Link”, you will be able to choose the account you want to link your property to.
- Confirm and Next to choose your site’s web data stream. Review and submit your settings.
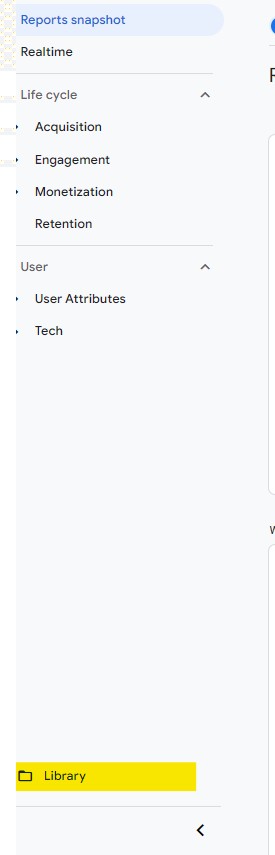
- Go to “Library” to select the reports.
- Select “Search Console” under the “Collections” tab.
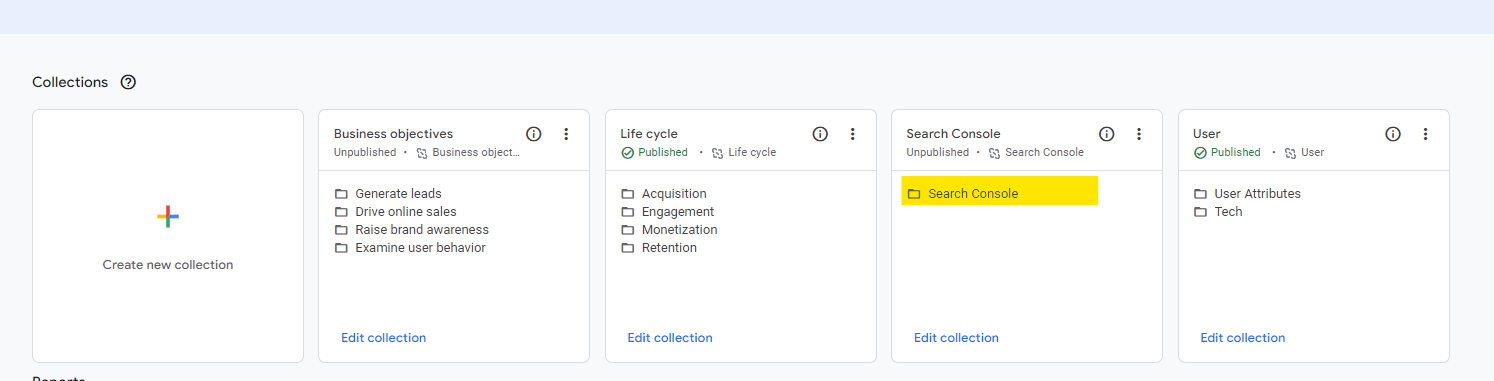
- Click “Publish”
- The report will appear on the left hand side panel and with time it will start generating the relevant queries that have been used to find your site.
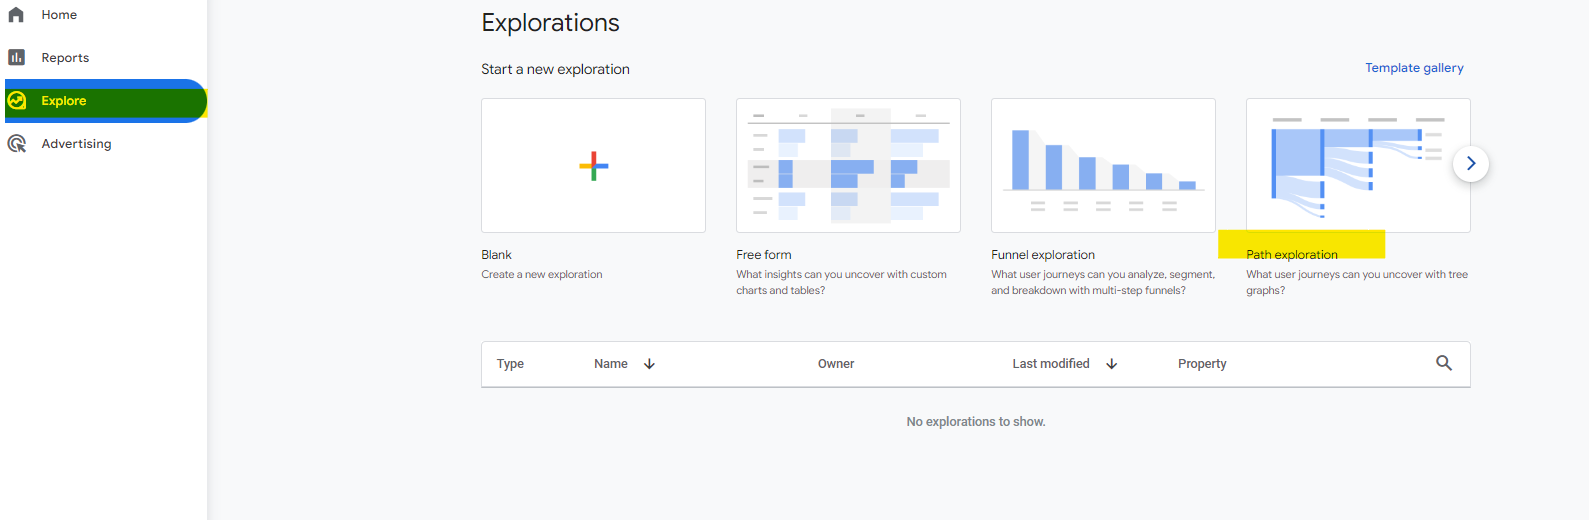
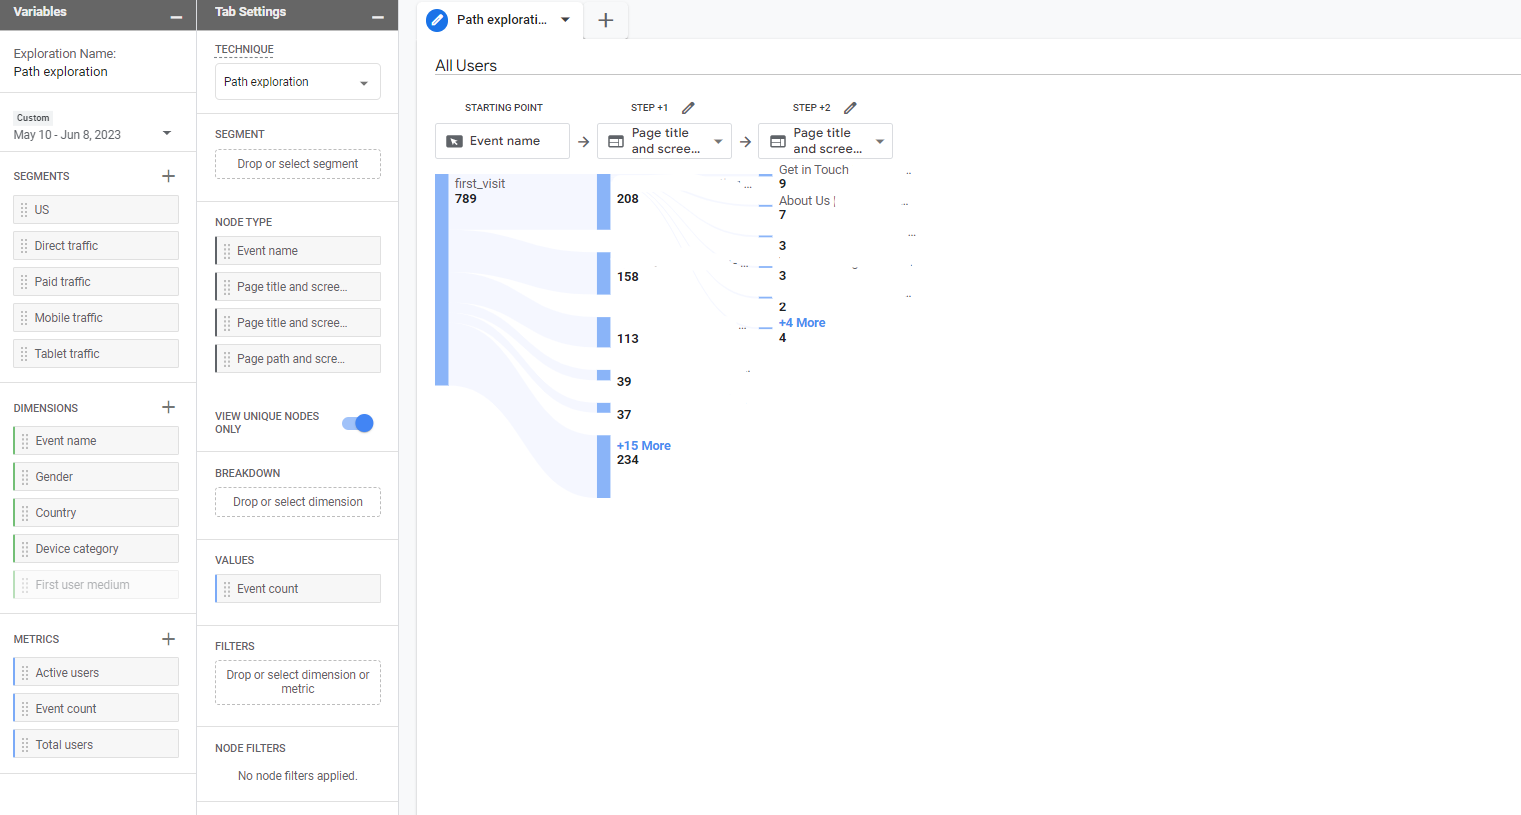
User journeys
Although the Behavioural Flow as we know it is not available in GA4 you are able to use Path Exploration to visualise your user journeys, what actions they take, and what pages they move to.
This is especially important when you want to look at page drop-off rates and understand how to optimise your site in order to increase conversions.
As an example, when one of your top category or product pages has a high drop-off rate, you might want to think about adapting your calls to action or improving the user experience.
To find the Path Exploration report:
- Go to “Reports” and “Explore” and select “Path Exploration”.
- Using this report, you can customise your view and select different variables to analyse your site performance and conversion elements. For example, you’ll be able to check how many pages visited one of your landing pages and whether they have ended up taking any actions, such as filling in a contact form.
Takeaways
The bottom line is that if you haven’t already, you need to get GA4 set up immediately in order to continue tracking your website’s performance.
Fortunately, the process is relatively easy to follow and although the new interface may need some getting used to, our tips above should help you find value in the updated platform.
With that said, there may be a lot of questions you still have about making the most of GA4. Contact us if you have any questions and follow us on LinkedIn for some useful tips.
[Banner Image Courtesy of Google]
Source: quibble.digital

